May 22 to May 26 2023
Current Archeological Prospection:
Advances for Non-destructive Investigations Workshop 2023
NPS Workshop Data
National Park Service
The National
Center for Preservation Technology and Training (NCPTT), the Midwest
Archeological Center, Wichita State University, and the Friends of NCPTT, are
hosting a five-day training workshop: Current Archeological Prospection
Advances for Non-Destructive Investigations. In its thirtieth year, the
workshop will be held May 22–26, 2023 at the Country Club site (14CO3) in
Arkansas City, Kansas.
The
workshop began at 8 am on Monday, May 22 and end at 5 pm on Friday, May 26.
Although the schedule was weather dependent, the general format will consist of
lectures planned in the morning, afternoons dedicated to hands-on fieldwork,
and short evening sessions oriented toward other topics like data processing.
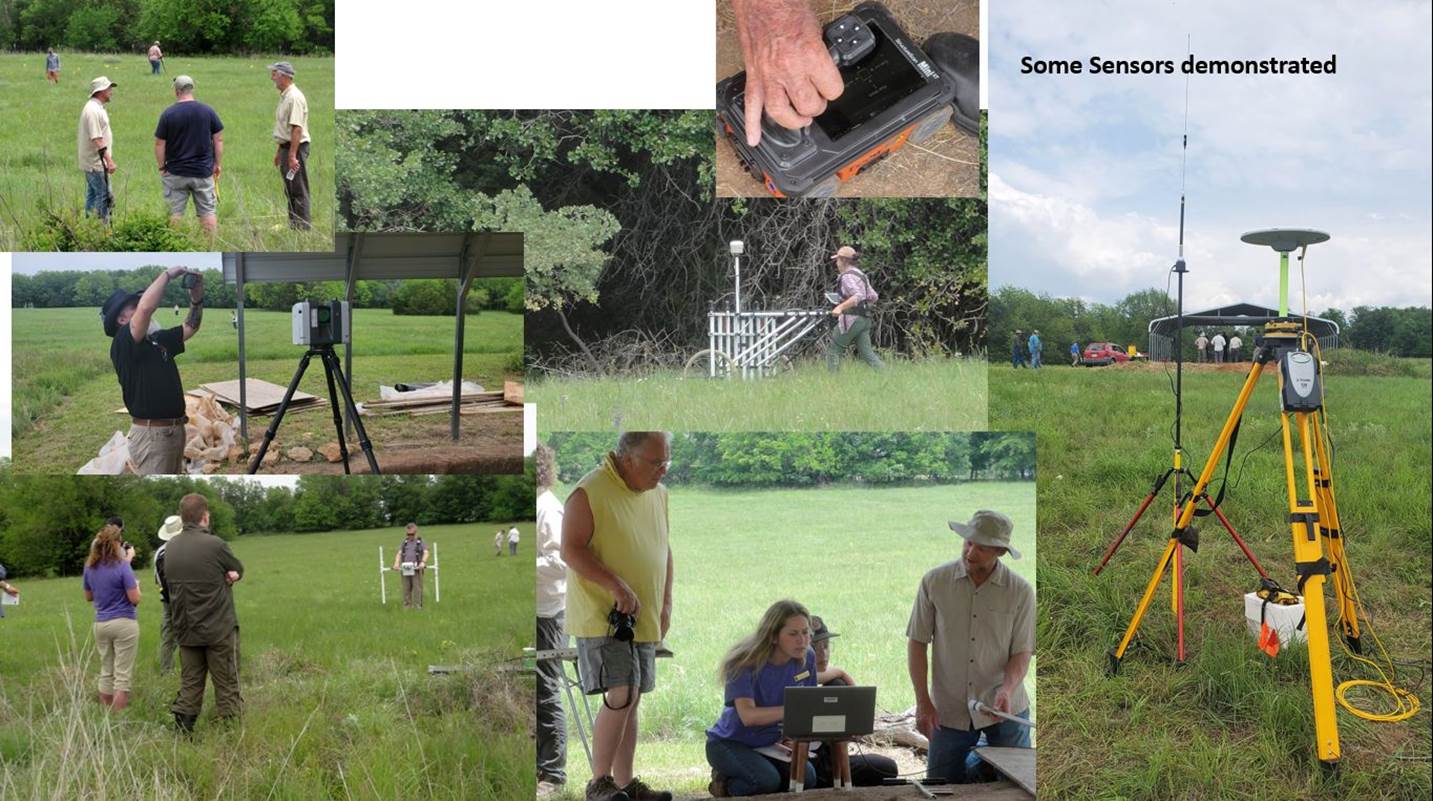
Participants
were cultural resource managers and specialists from federal, state, and local
government; private contractors; professors and students; and international
cultural resource personnel with responsibilities concerning the
identification, evaluation, and preservation of archeological and other
cultural resources.
Objective
The
workshop was organized to provide a practical introduction to ground-based
geophysical and other remote sensing techniques that are commonly used for the
purposes of identifying, evaluating, and preserving archeological resources.
Among these ground-based methods are magnetometry, ground-penetrating radar,
earth resistance, metal detecting, conductivity, and magnetic susceptibility.
Other techniques that receive attention include terrestrial and airborne lidar,
and aerial color and thermal infrared imaging. Lectures cover theory of
operation, survey methods, data processing, and interpretation. Participants
also have daily opportunities to gain introductory level, hands-on experience
in the field
Workshop Site (14CO3)
Once
composed of 22 separate Great Bend aspect sites (which generally date between
AD 1450 and 1700), Country Club is widely regarded as the ancestral Wichita
settlement of Etzanoa, visited by Spanish
conquistador Juan de Oñate in 1601. Accounts from the Oñate expedition are
tantalizing. Well over a thousand houses clustered among agricultural fields
are said to have stretched for miles along what is today known as Walnut River.
The site is represented archeologically by several extant earthen mounds, low midden
mounds, houses, and storage pits. A recent publication in American Antiquity
(Casana et al. 2020) describes the results of a multi sensor UAV survey in one
area of the site where a suspected “council circle,” a ceremonial earthwork was
documented. Current investigations of the site by Wichita State University have
received considerable media attention.
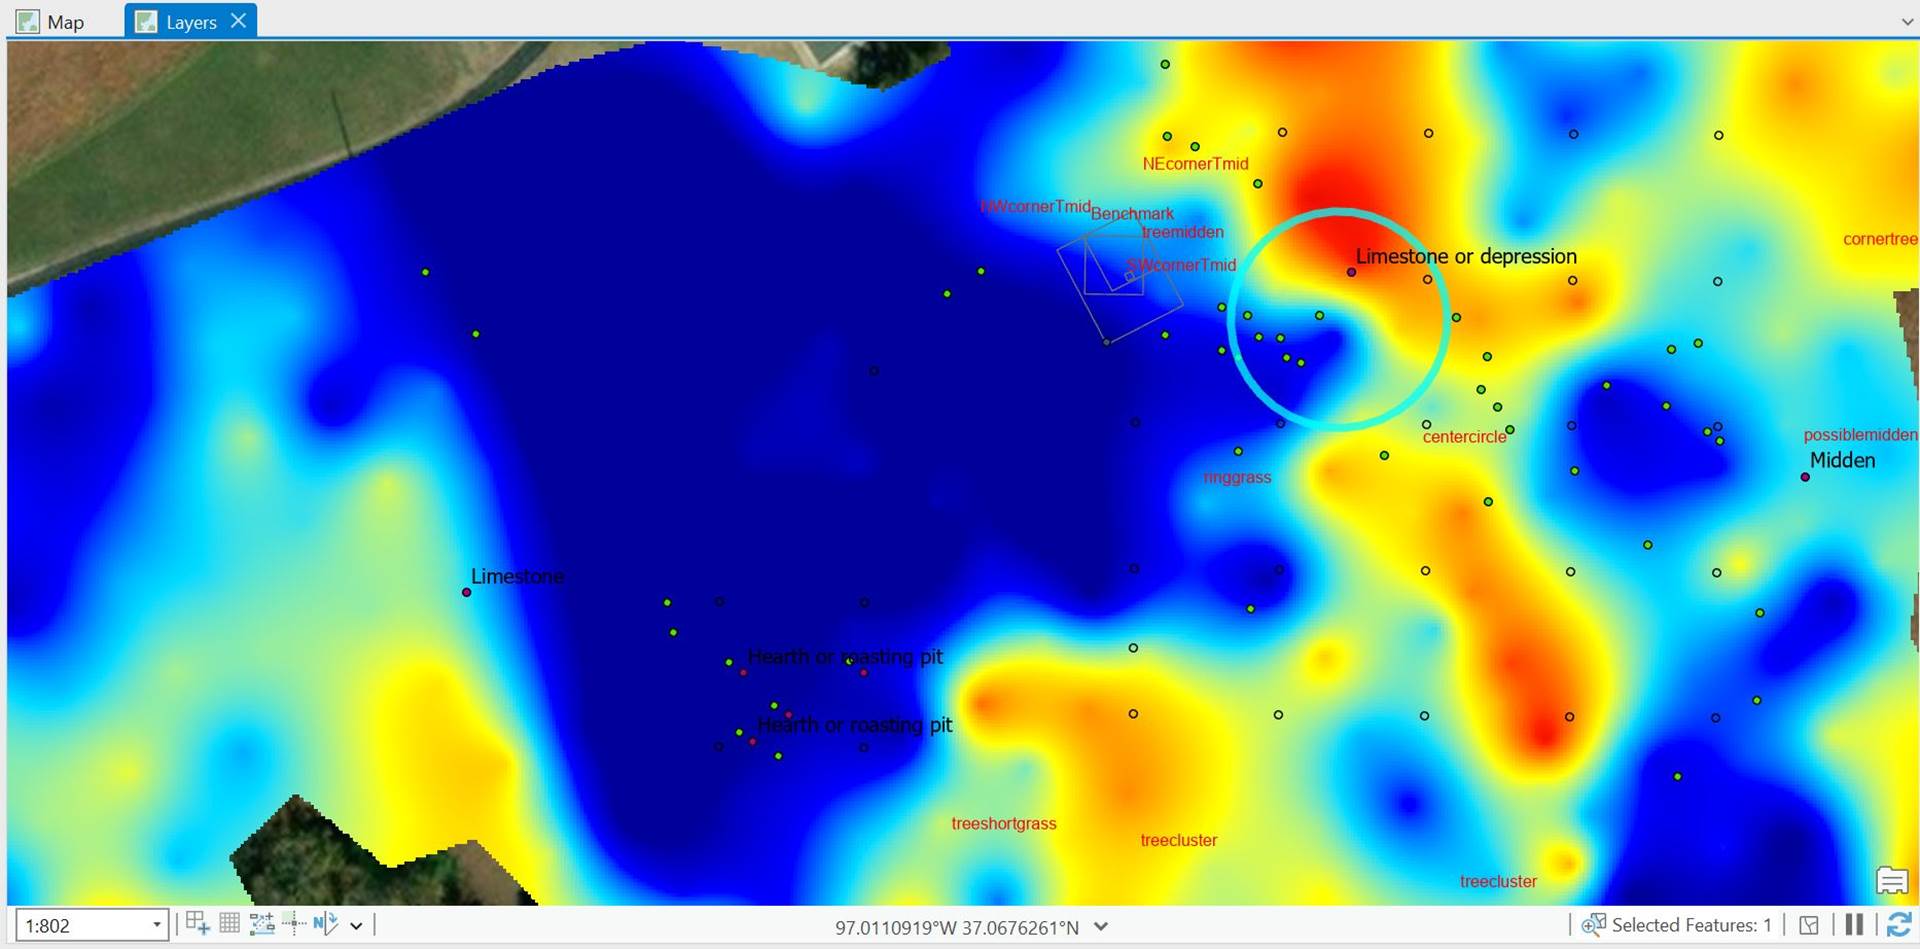
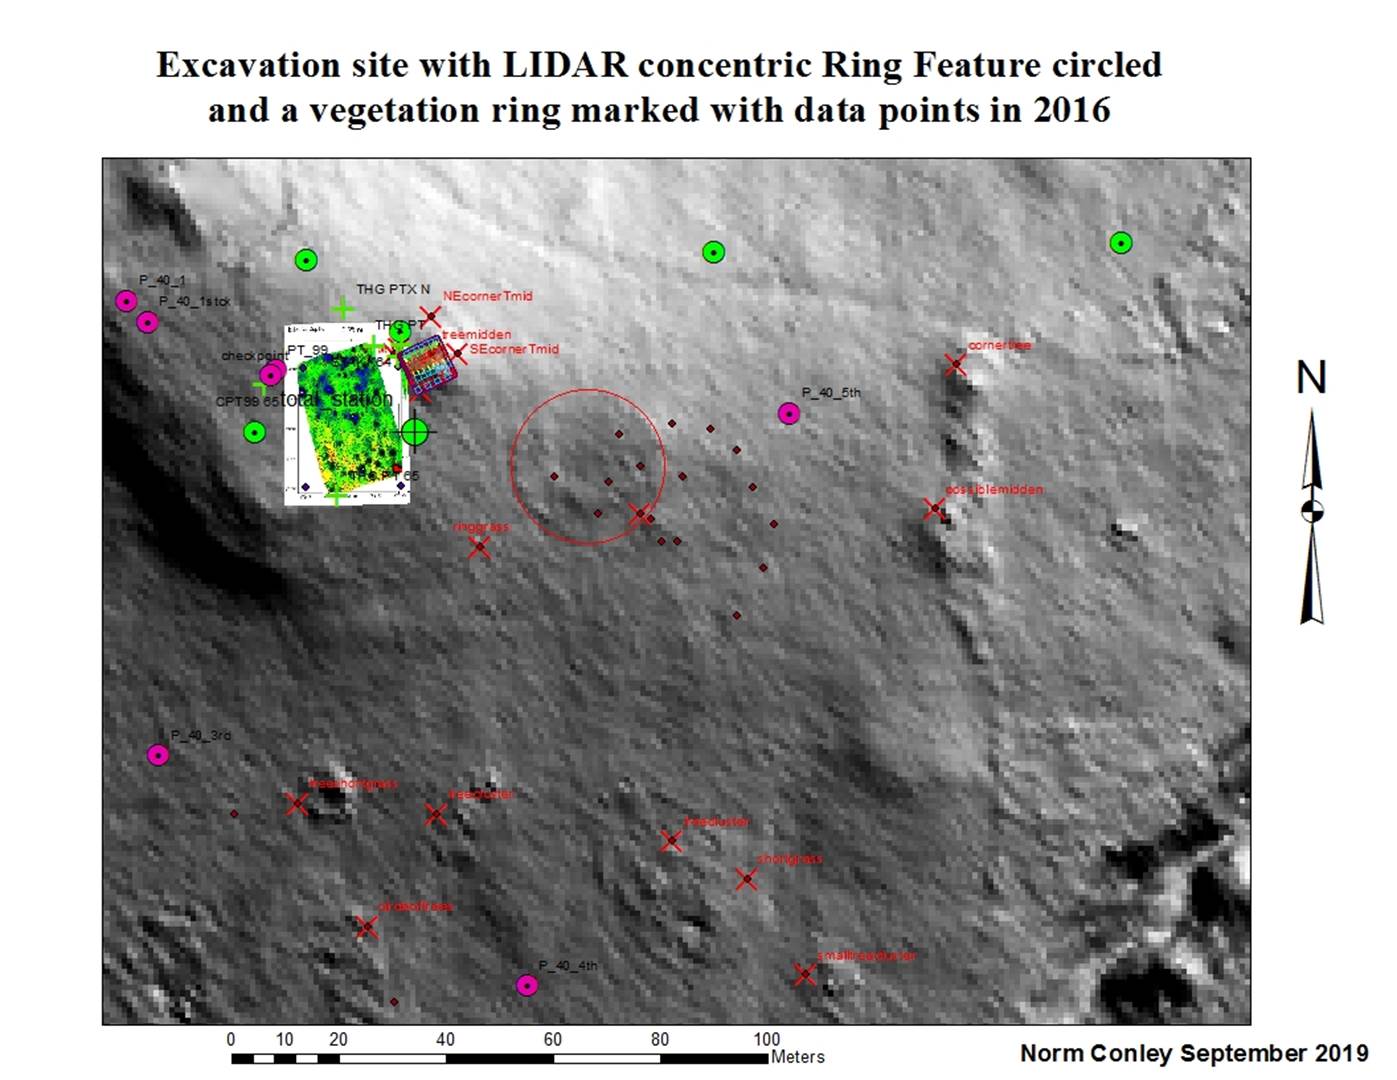
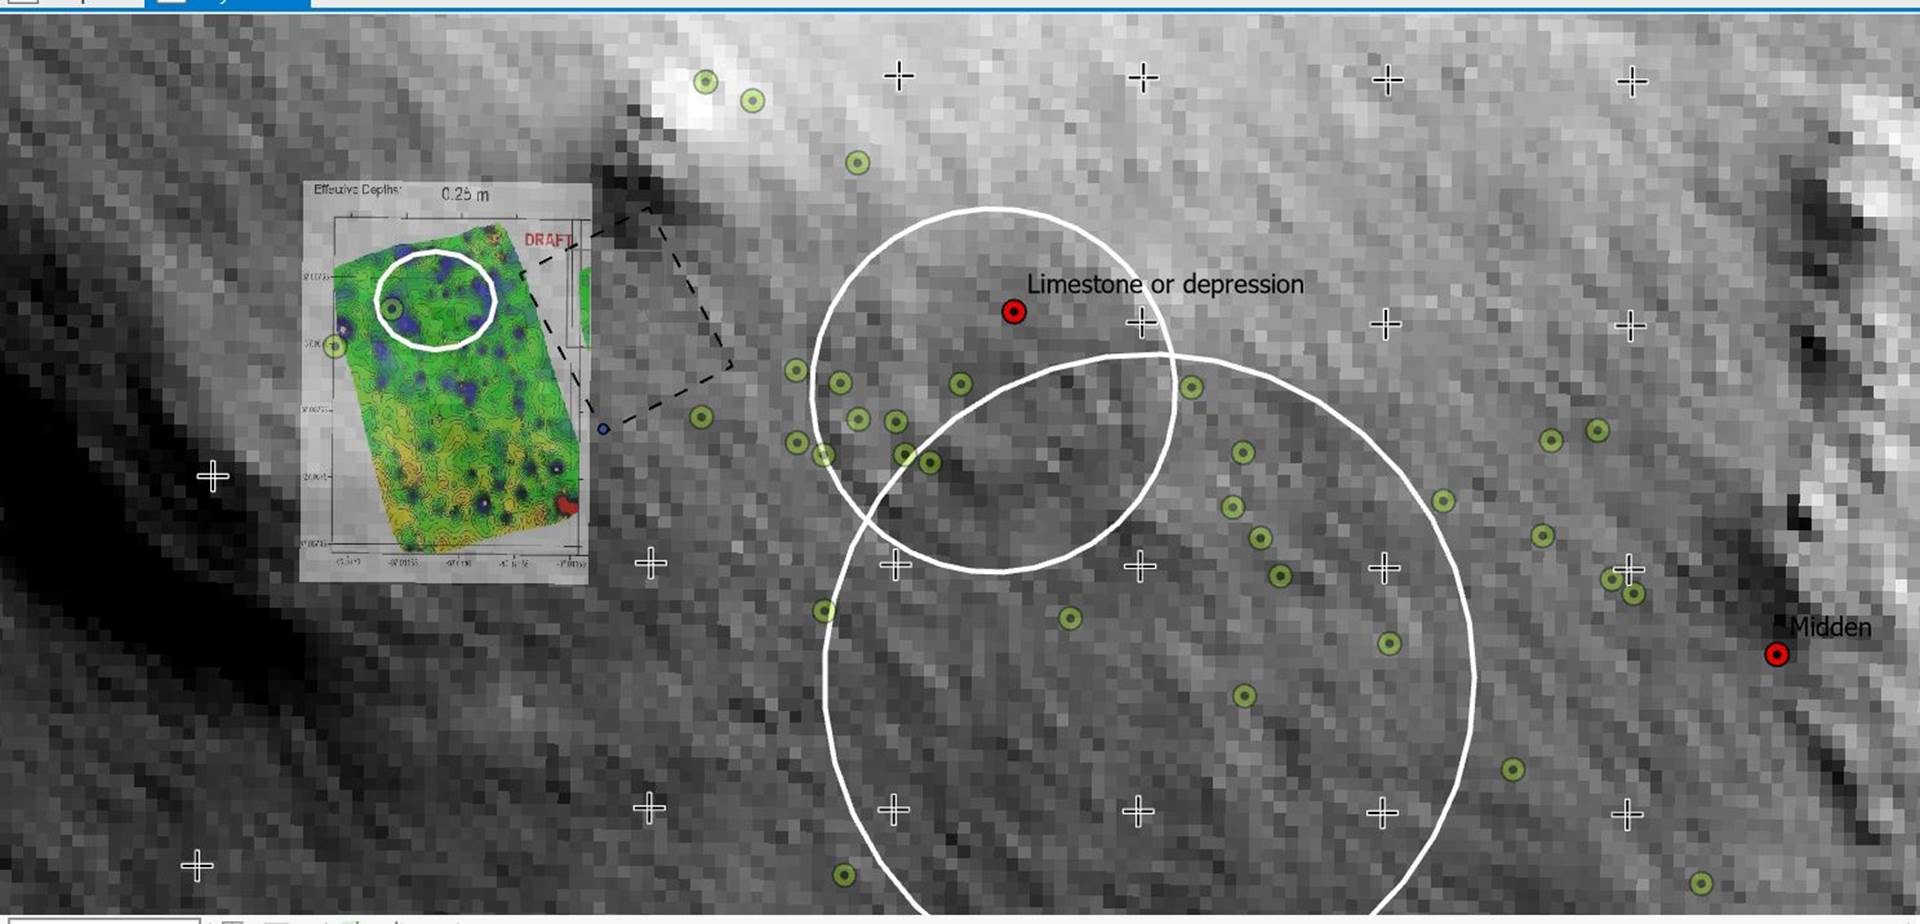
LIDAR one meter data at the site with
features labeled
Lidar, which stands for Light Detection and Ranging, is a remote sensing
method that uses light in the form of a pulsed laser to measure ranges
(variable distances) to the Earth. These light pulses—combined with other data
recorded by the airborne system — generate precise, three-dimensional
information about the shape of the Earth and its surface characteristics.
A lidar instrument principally consists of a laser, a scanner, and a
specialized GPS
receiver. Airplanes and helicopters are the most commonly used platforms for
acquiring lidar data over broad areas. Two types of lidar are topographic and
bathymetric. Topographic lidar typically uses a near-infrared laser to map
the land, while bathymetric lidar uses water-penetrating green light to also
measure seafloor and riverbed elevations.
Lidar systems allow scientists and mapping professionals to
examine both natural and manmade environments with accuracy, precision, and
flexibility. NOAA scientists are using lidar to produce more accurate shoreline
maps, make digital elevation models for use in geographic information systems,
to assist in emergency response operations, and in many other applications.
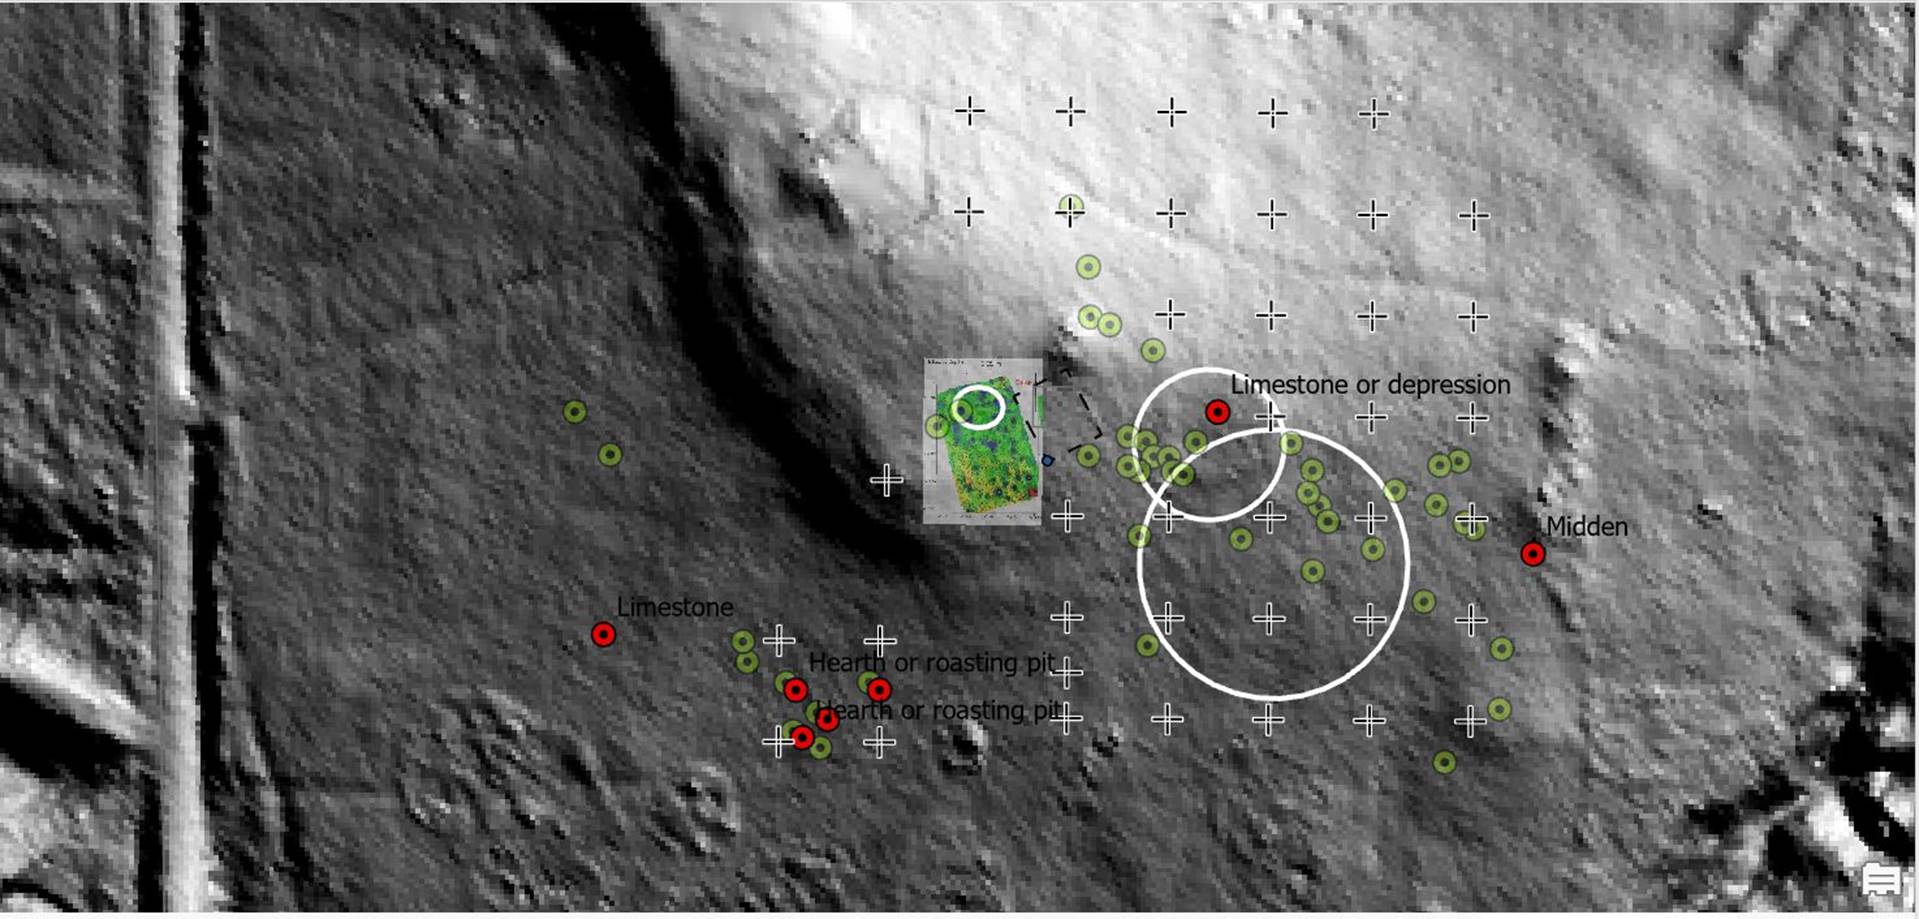
Magnetic Intensity Data again showing
features
Electrical resistance
surveys (also
called earth resistance or resistivity survey) are one of a number of methods
used in archaeological
geophysics, as well as in engineering geological investigations. In this
type of survey electrical
resistance meters are used to detect and map subsurface archaeological features and
patterning.
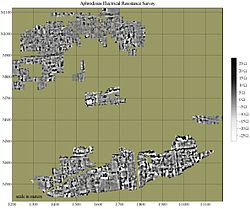 Electrical resistance map of ancient Aphrodisias
Contents
OverviewEdit
Electrical resistance meters
can be thought of as similar to the Ohmmeters used to test electrical circuits.
Archaeological features can be mapped when they are of higher or lower
resistivity than their surroundings. A stone foundation might impede the flow
of electricity, while the organic deposits within a midden might conduct
electricity more easily than surrounding soils. Although generally used in
archaeology for planview mapping, resistance methods
also have a limited ability to discriminate depth and create vertical profiles
(see Electrical
resistivity tomography). Further applications include the measurement of
the electrical
resistivity of concrete to determinate the corrosion potential in
concrete structures. Electrical resistance surveying is one of the most popular
geophysical methods thanks to the fact it is a nondestructive and economically
favorable investigation.[1]
Magnetic Susceptibility with features
|
Magnetic
Susceptibility Magnetic
susceptibility is a fundamental concept in the field of magnetism that
describes the magnetization response of a material to an applied magnetic
field. It is a measure of the degree to which a material becomes magnetized
in response to an external magnetic field. Magnetic susceptibility has many
practical applications, including the detection of minerals, environmental
studies, and archaeology. In this
article, we will discuss the concept of magnetic susceptibility in detail,
exploring its types, properties, and applications. We will also examine the
different techniques and instruments used for measuring magnetic
susceptibility and their advantages and limitations. Finally, we will explore
some of the cutting-edge research in the field of magnetic susceptibility and
its potential for future developments. Magnetic
susceptibility and permeability are
two important concepts in magnetism that describe the ability of a material
to be magnetized in the presence of an external magnetic field. Magnetic
susceptibility refers to the degree to which a material becomes magnetized in
response to an applied magnetic field. It is a dimensionless quantity that
measures the ratio of the magnetization of a material to the applied magnetic
field. Materials with a positive magnetic susceptibility become magnetized in
the same direction as the applied field, while those with a negative
susceptibility become magnetized in the opposite direction. To put it simply,
M=χvH where M is the Magnetization, H is the
magnetic field strength and χv is the volume
susceptibility. Permeability
μ links magnetizing field H and magnetic flux density B in a material in
the following way B = μH. Relative
permeability (μr) can be expressed as the
ratio of permeability (μ) and permeability of vacuum (μ0), which is
a fundamental constant of nature. The
relative permeability is a dimensionless quantity that is directly linked to
magnetic susceptibility where χv = μr-1. Both
magnetic susceptibility and permeability are important parameters for
understanding the behavior of magnetic materials, and they are commonly used
in the design and analysis of magnetic devices such as transformers, motors, and magnetic storage media. |
DRONE Heat Map and visible light
(Casana et al. 2020) with
features
While archaeologists have long understood that thermal and multi-spectral imagery can potentially reveal a wide range of ancient cultural landscape features, only recently have advances in drone and sensor technology enabled us to collect these data at sufficiently high spatial and temporal resolution for archaeological field settings. This paper presents results of a study at the Enfield Shaker Village, New Hampshire (USA), in which we collect a time-series of multi-spectral visible light, near-infrared (NIR), and thermal imagery in order to better understand the optimal contexts and environmental conditions for various sensors. We present new methods to remove noise from imagery and to combine multiple raster datasets in order to improve archaeological feature visibility. Analysis compares results of aerial imaging with ground-penetrating radar and magnetic gradiometry surveys, illustrating the complementary nature of these distinct remote sensing methods. Results demonstrate the value of high-resolution thermal and NIR imagery, as well as of multi-temporal image analysis, for the detection of archaeological features on and below the ground surface, offering an improved set of methods for the integration of these emerging technologies into archaeological field investigations.
Thermal and multi-spectral surveys are able to quickly and
efficiently resolve historic anthropogenic features, depending on environmental
conditions and the diurnal cycle. With a combination of correct timing and post
processing, thermal and multi-spectral imaging can reveal some of the same
features detectable via traditional terrestrial geophysics but at a much larger
scale. These technologies are rapidly becoming critical tools for
archaeological remote sensing. While they may be more limited by environmental
restrictions than terrestrial geophysics, their cost effectiveness, ease of
use, and efficiency makes these attractive solutions for larger surveys.
Limiting factors can be overcome by selecting appropriate dates and times for
surveys based on environmental conditions, and hardware limitations can be
addressed via post-processing. These tools can fit well into a larger research
strategy that incorporates historical records, traditional terrestrial
geophysical survey, and excavation for validation and ground truthing.
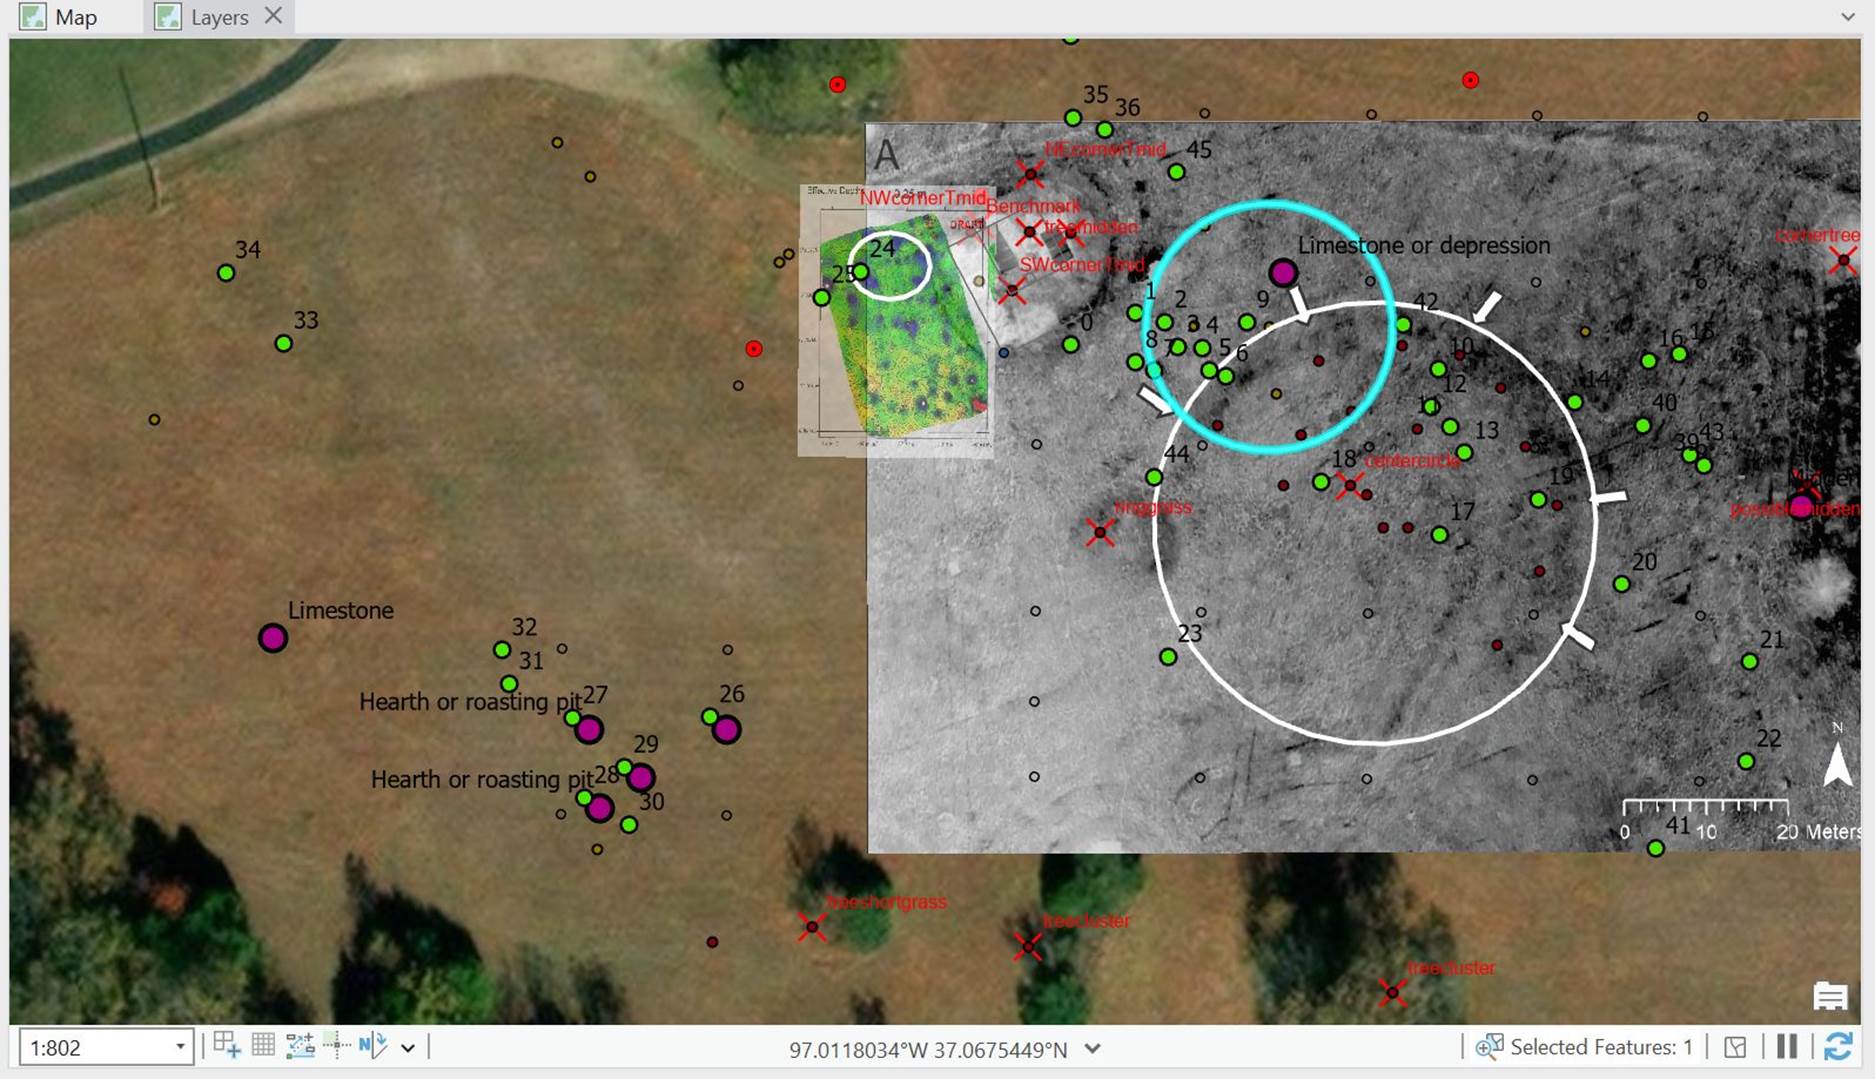
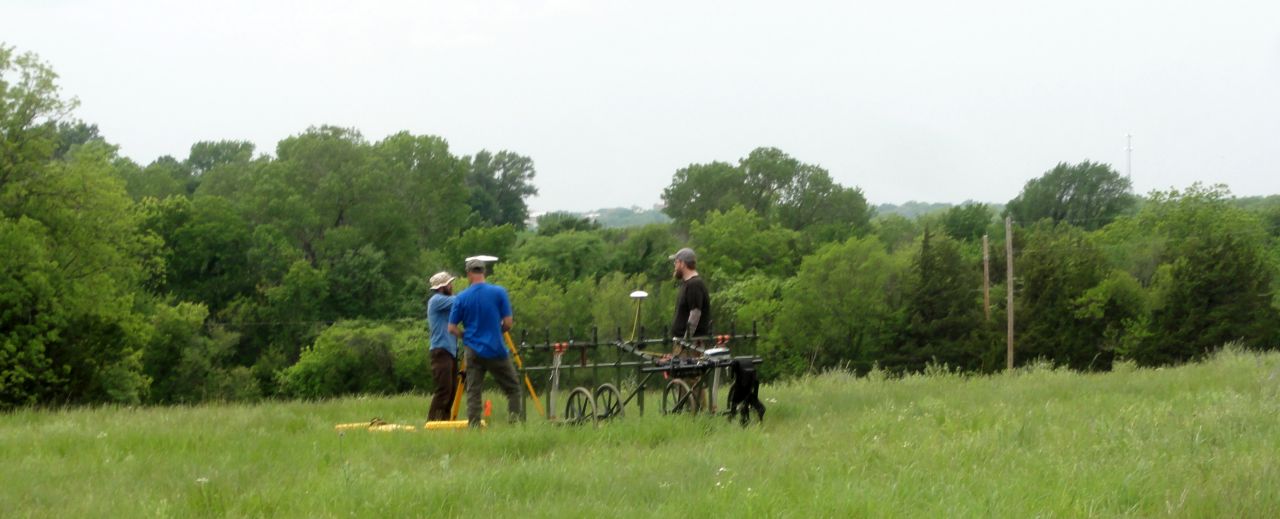
Magnetometry CART responsible for
gathering the following data
Magnetic Data
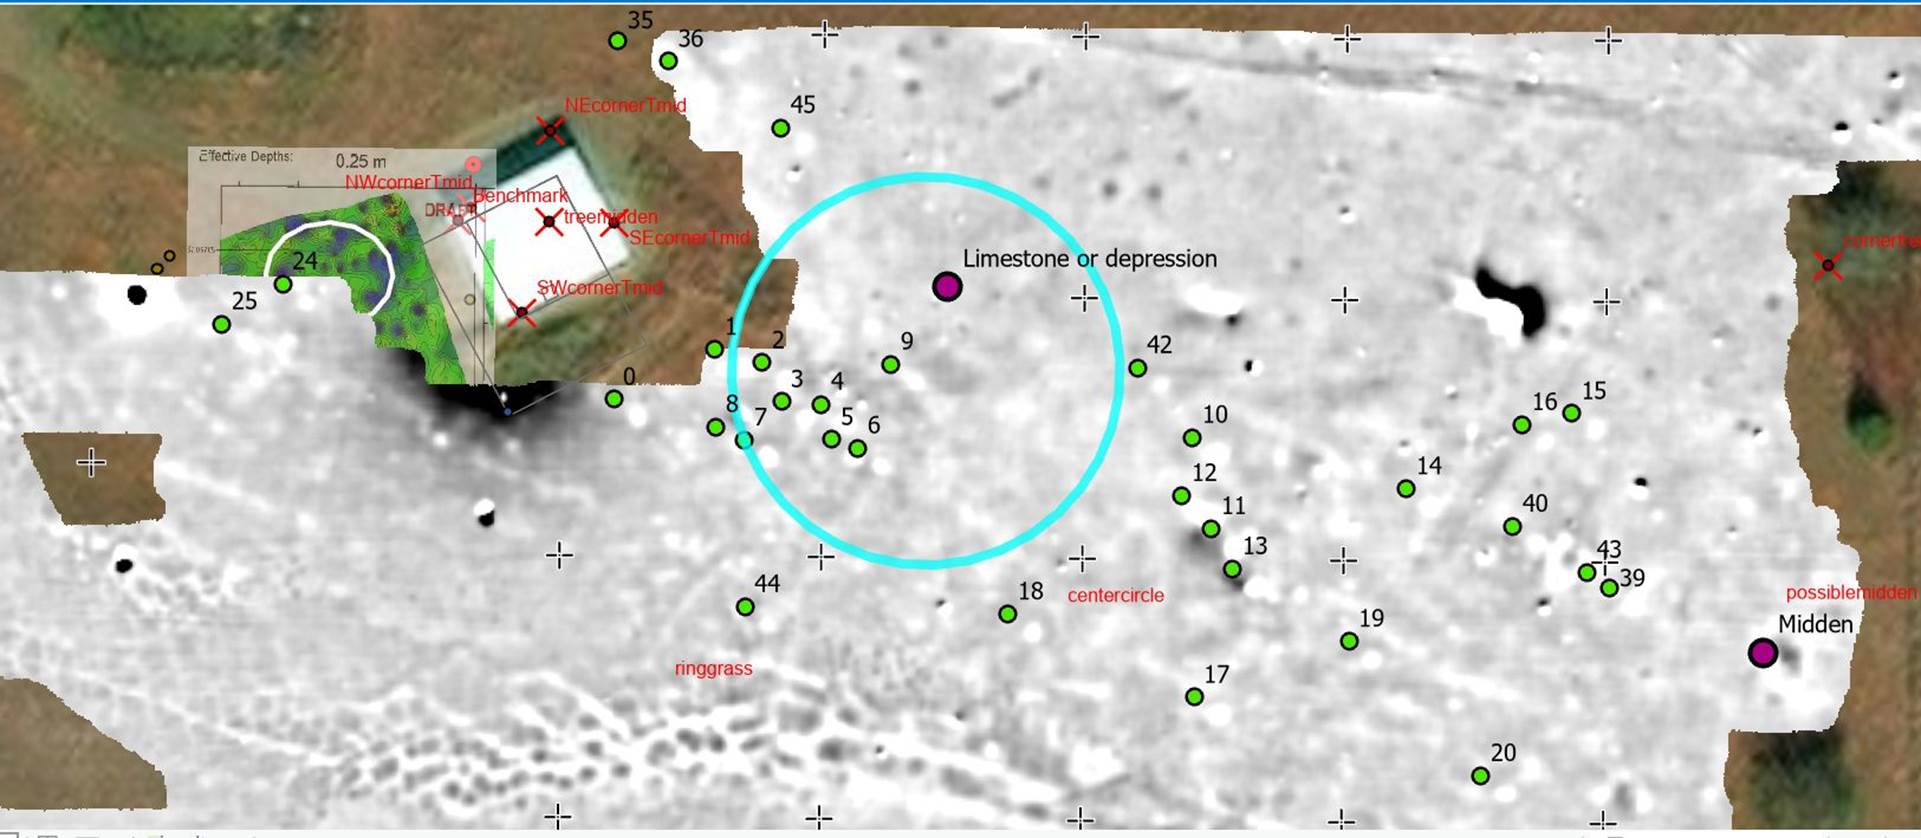
An area to the NE of the Workshop
study area showing features
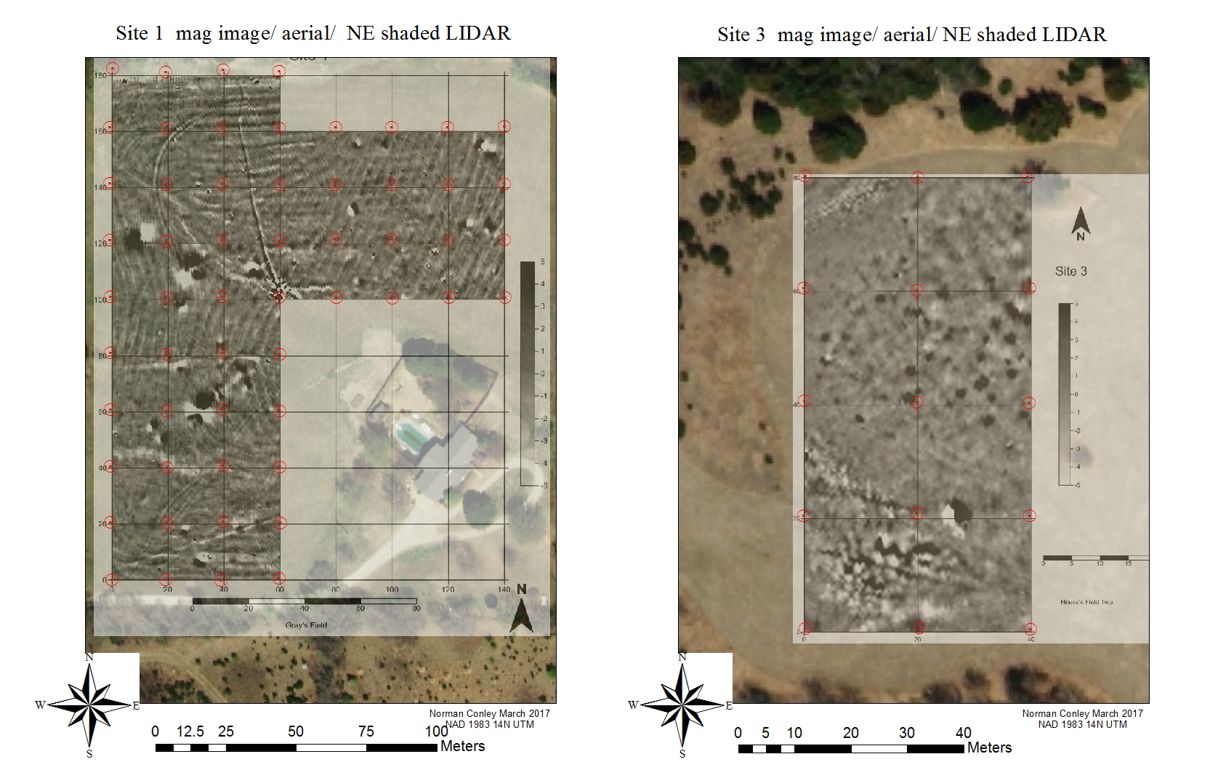
One meter LIDAR with Features
Electromagnetic induction (EMI)
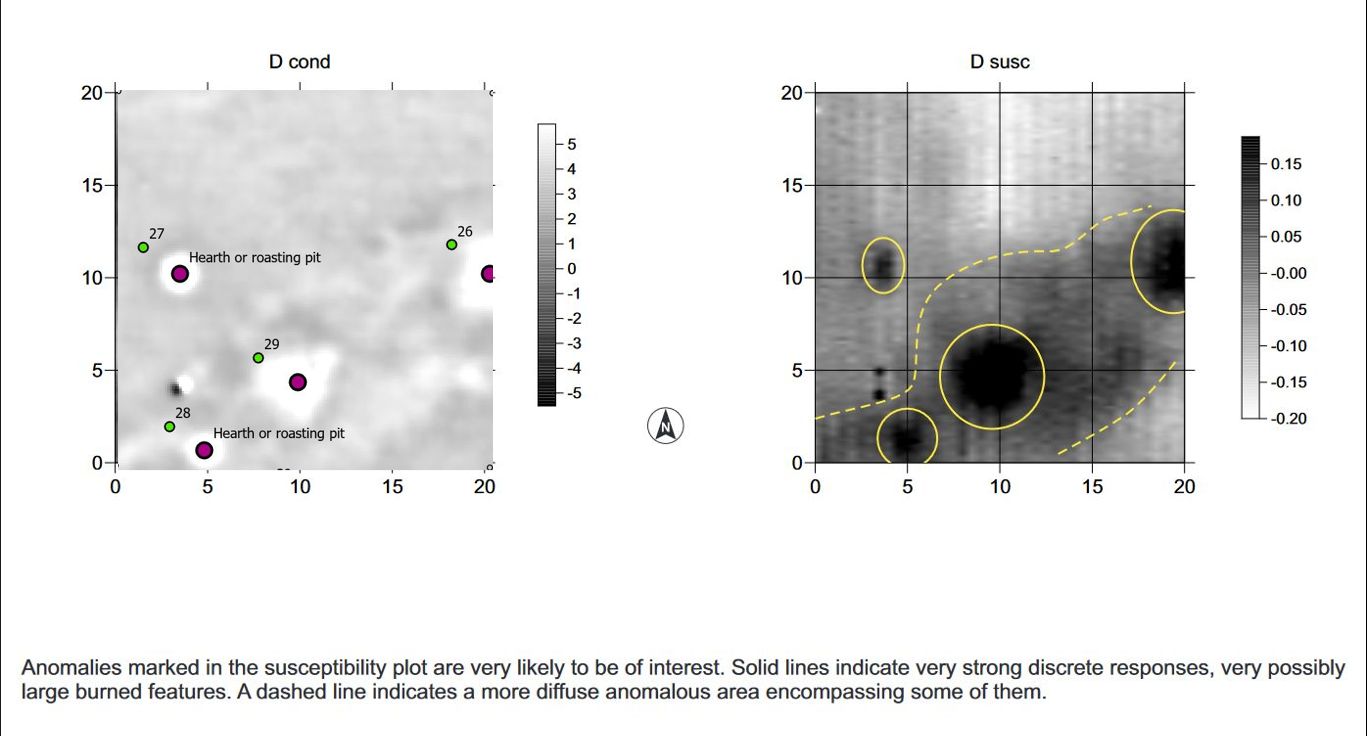
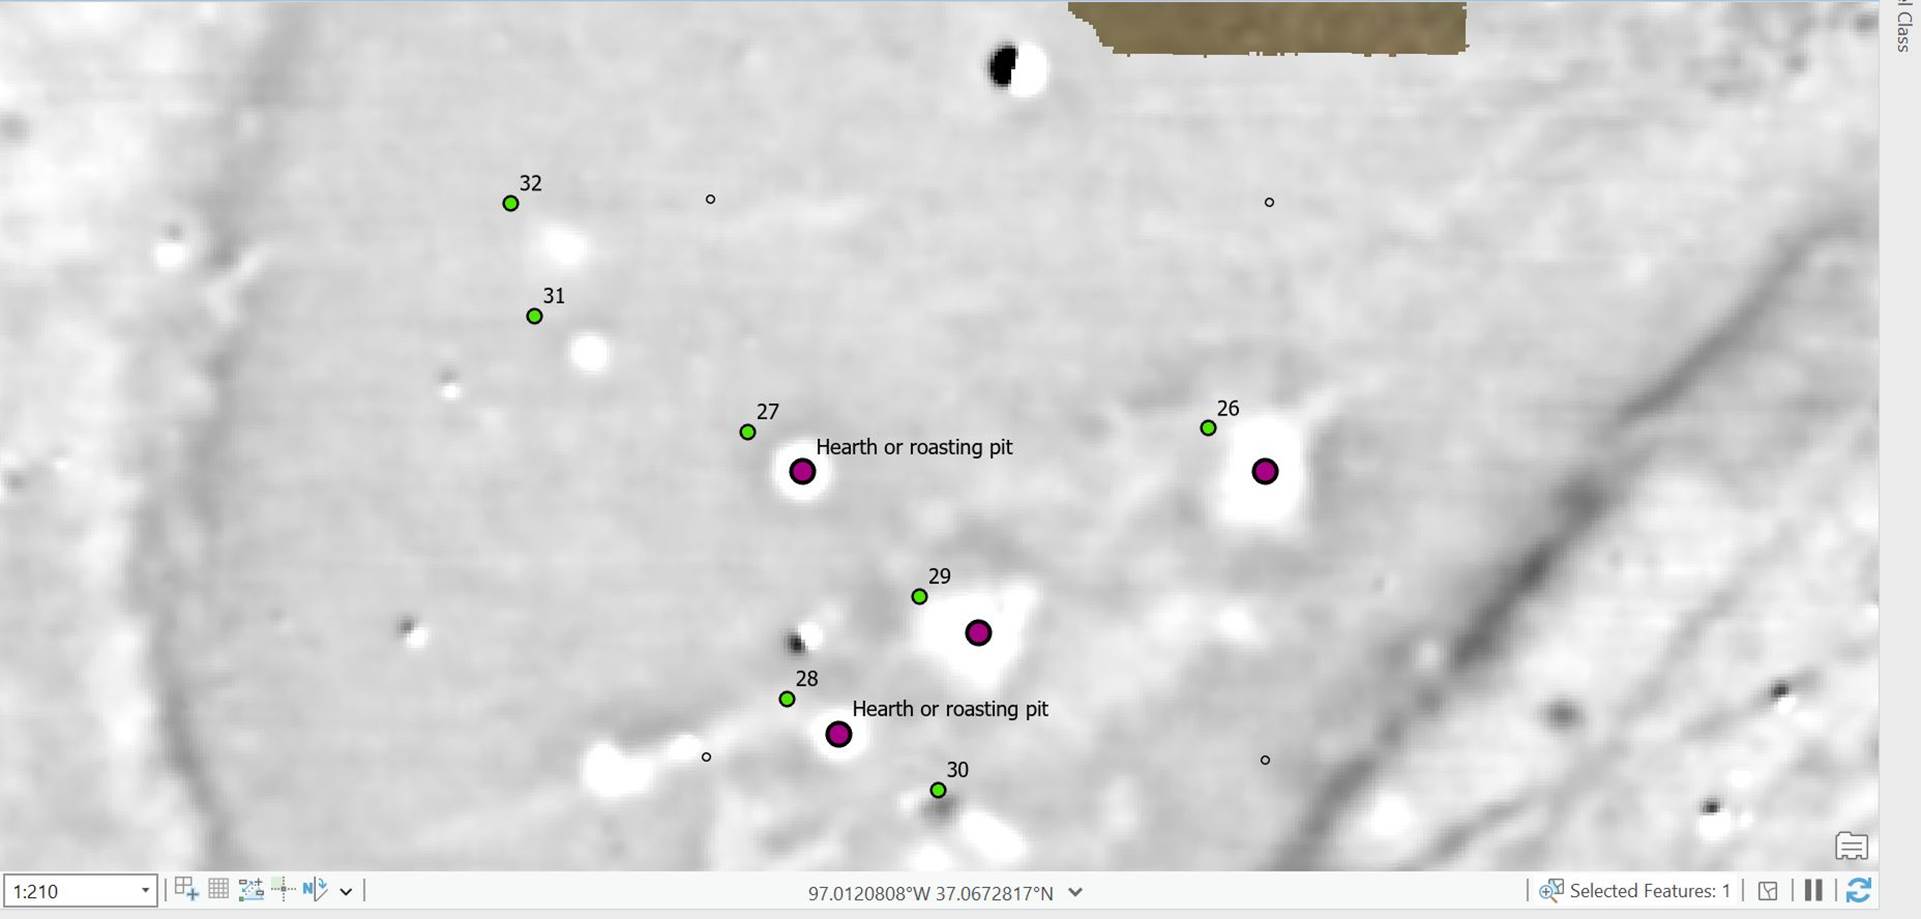
ground truthing recommendations (preliminary).
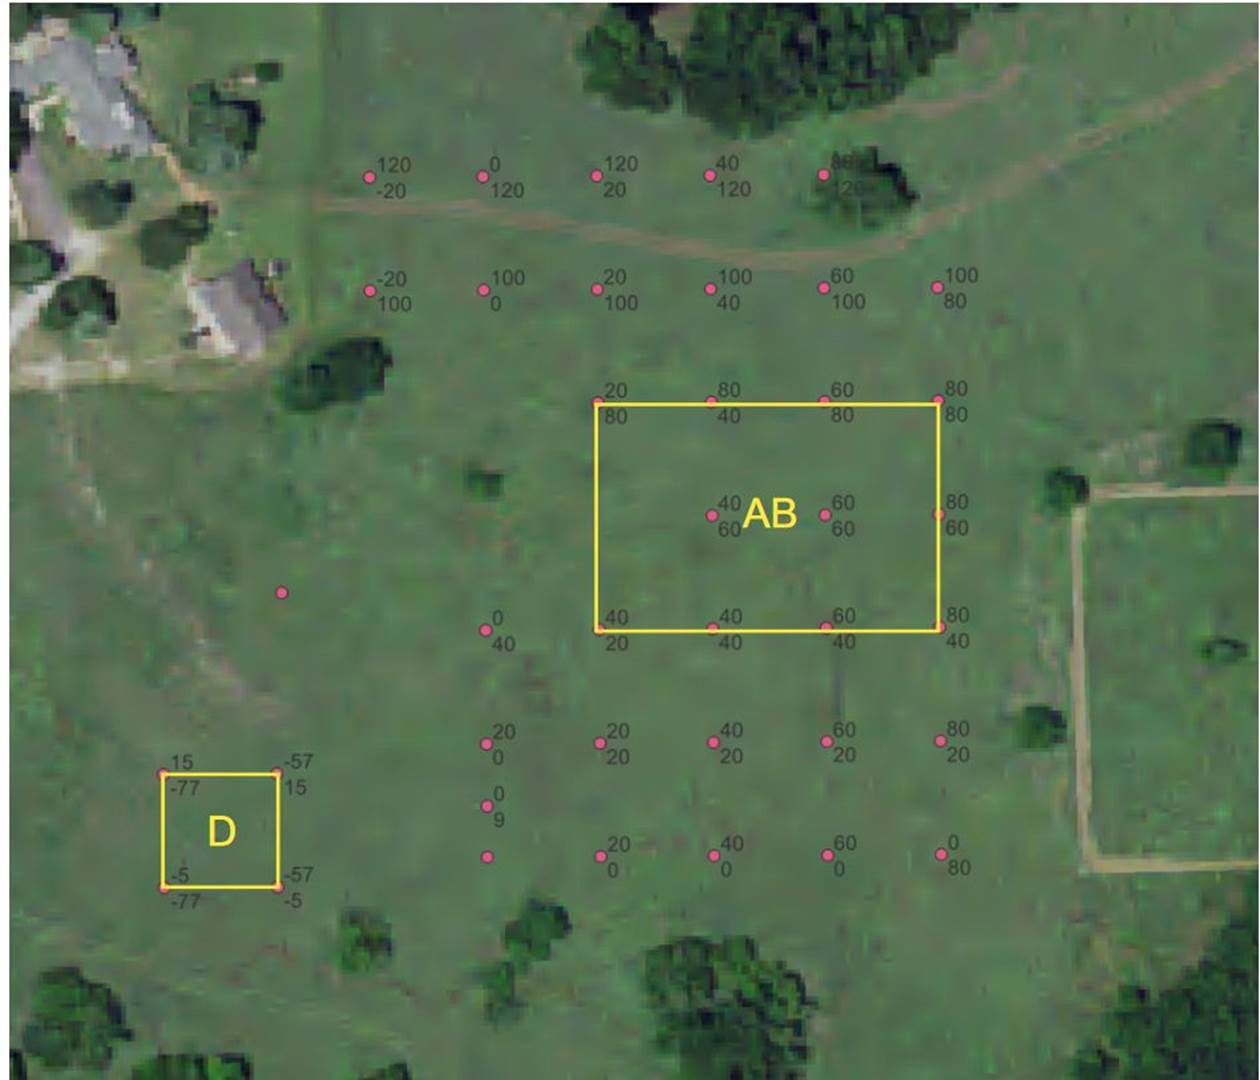
Three areas were surveyed with EMI, mapping EM conductivity and magnetic
susceptibility patterning. Field designations for the data sets presented here
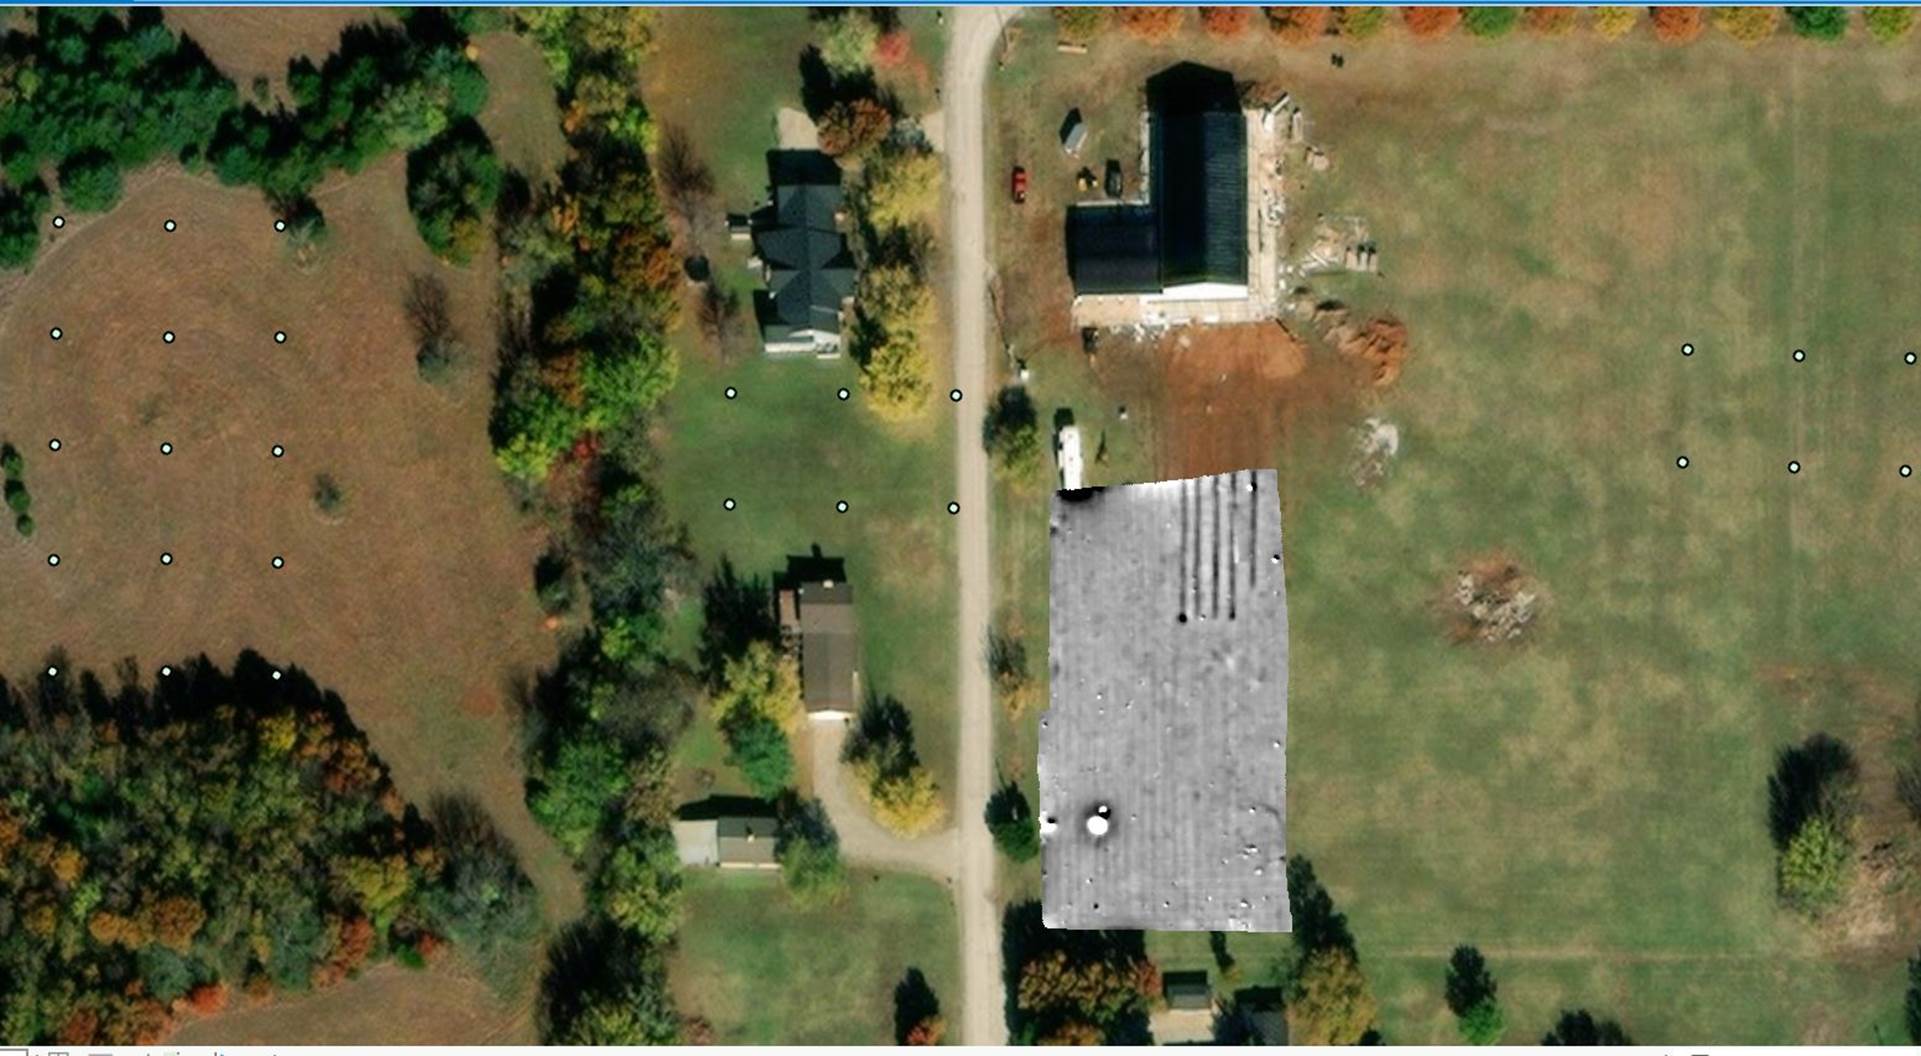
are AB, D, and E.
Areas AB and E are staked in the area around the excavation in progress during
the Workshop.
The Area AB maps have site grid coordinates.
THE AREA D MAP DOES NOT HAVE SITE GRID COORDINATES, but it is staked on the
ground as a separate 20x20m grid. I am waiting for clarification regarding
real-world/site grid coordinates.
Area E is the area east of Lord Rd. that you directed me to on the last day of
the workshop. I left it staked with yellow tent pegs, and don’t have GPS
coordinates at this time
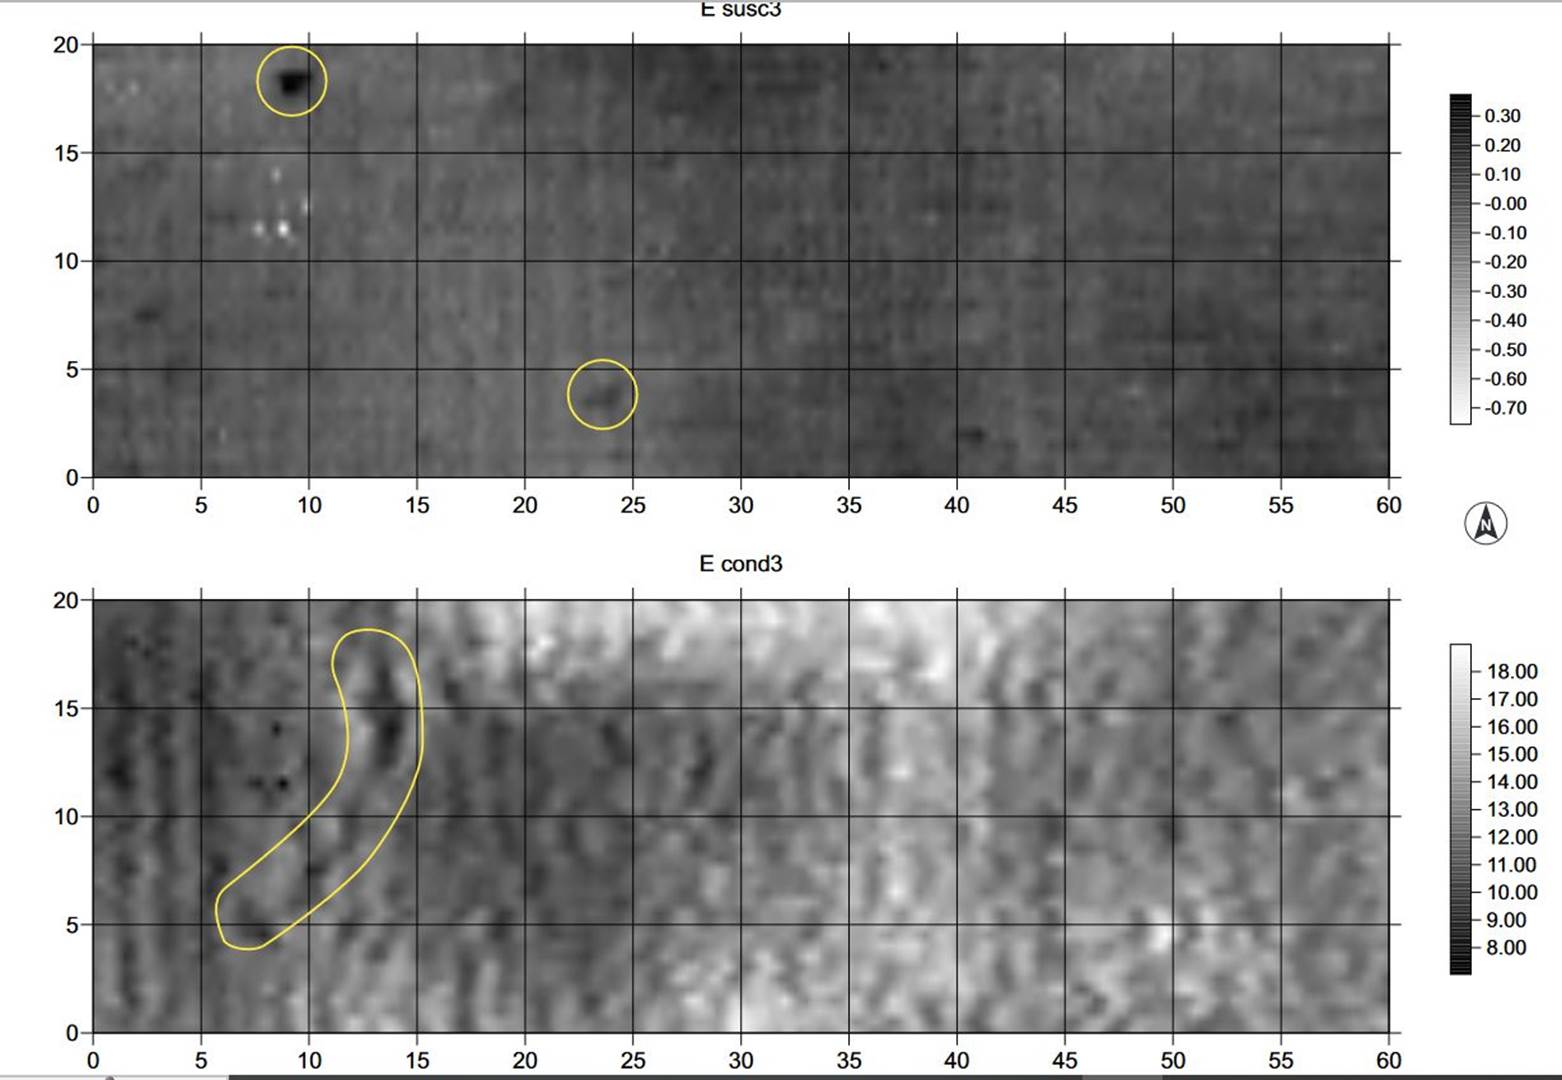
AB condition 3
In this
conductivity map (depths up to approximately 1.8m), numerous conductivity highs
appear that are not expressed in data isolating shallower depths. This suggests
the principal source is a meter or more deep. The depth, size, and patterning
are consistent with large pits exposed in the nearby excavation. High
conductivity suggests organic enrichment or finer-grained soils, also
consistent with pit features. One cluster of these are circled in yellow as an
example, but many very similar anomalies appeart
throughout. an orange circle indicates a particularly large and high contrast
conductivity high. The wandering linear anomaly correlates with vegetation
patterning, and is probably not of interest

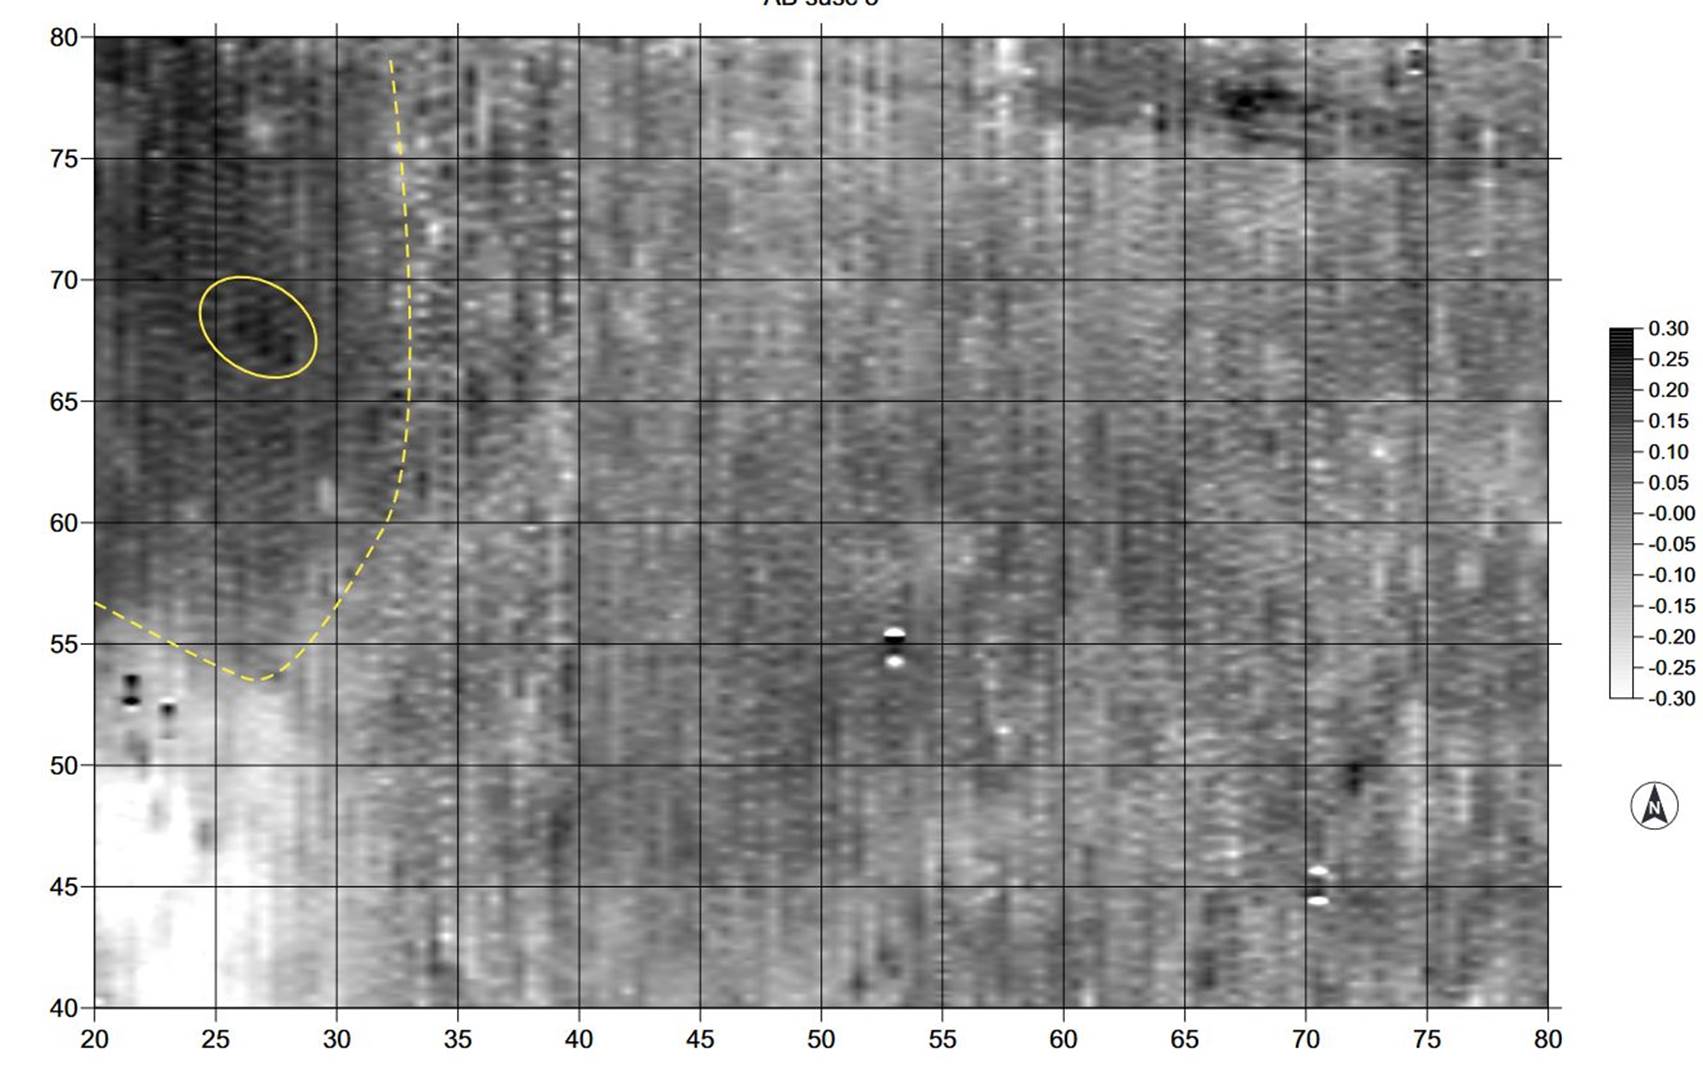
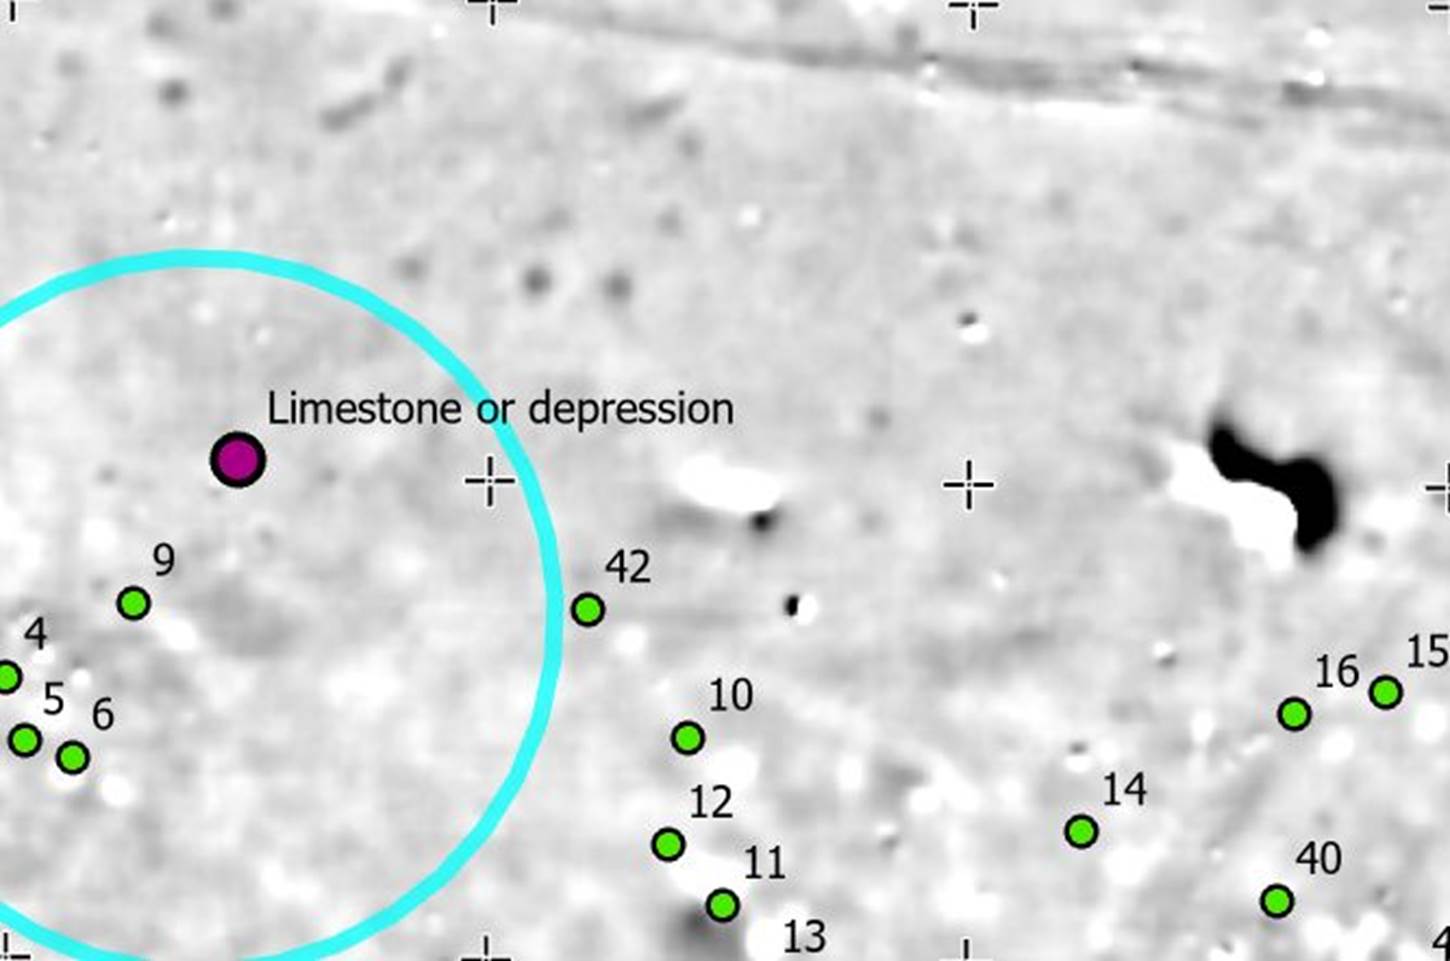
There
appears to be less of interest in the susceptibility data in this are than in
conductivity. Patterning is generally rather diffuse, and seems to have more to
do with topographic and vegetation features than likely archaeological ones. In
general, we would expect features of interest to appear as susceptibility
highs. A diffuse area of high susceptibility is indicated by a dashed yellow
line. A more discrete susceptibility high is circled within it, with similar
but more obscure examples not marked. The strongest signal is ignored, and is
probably modern metal
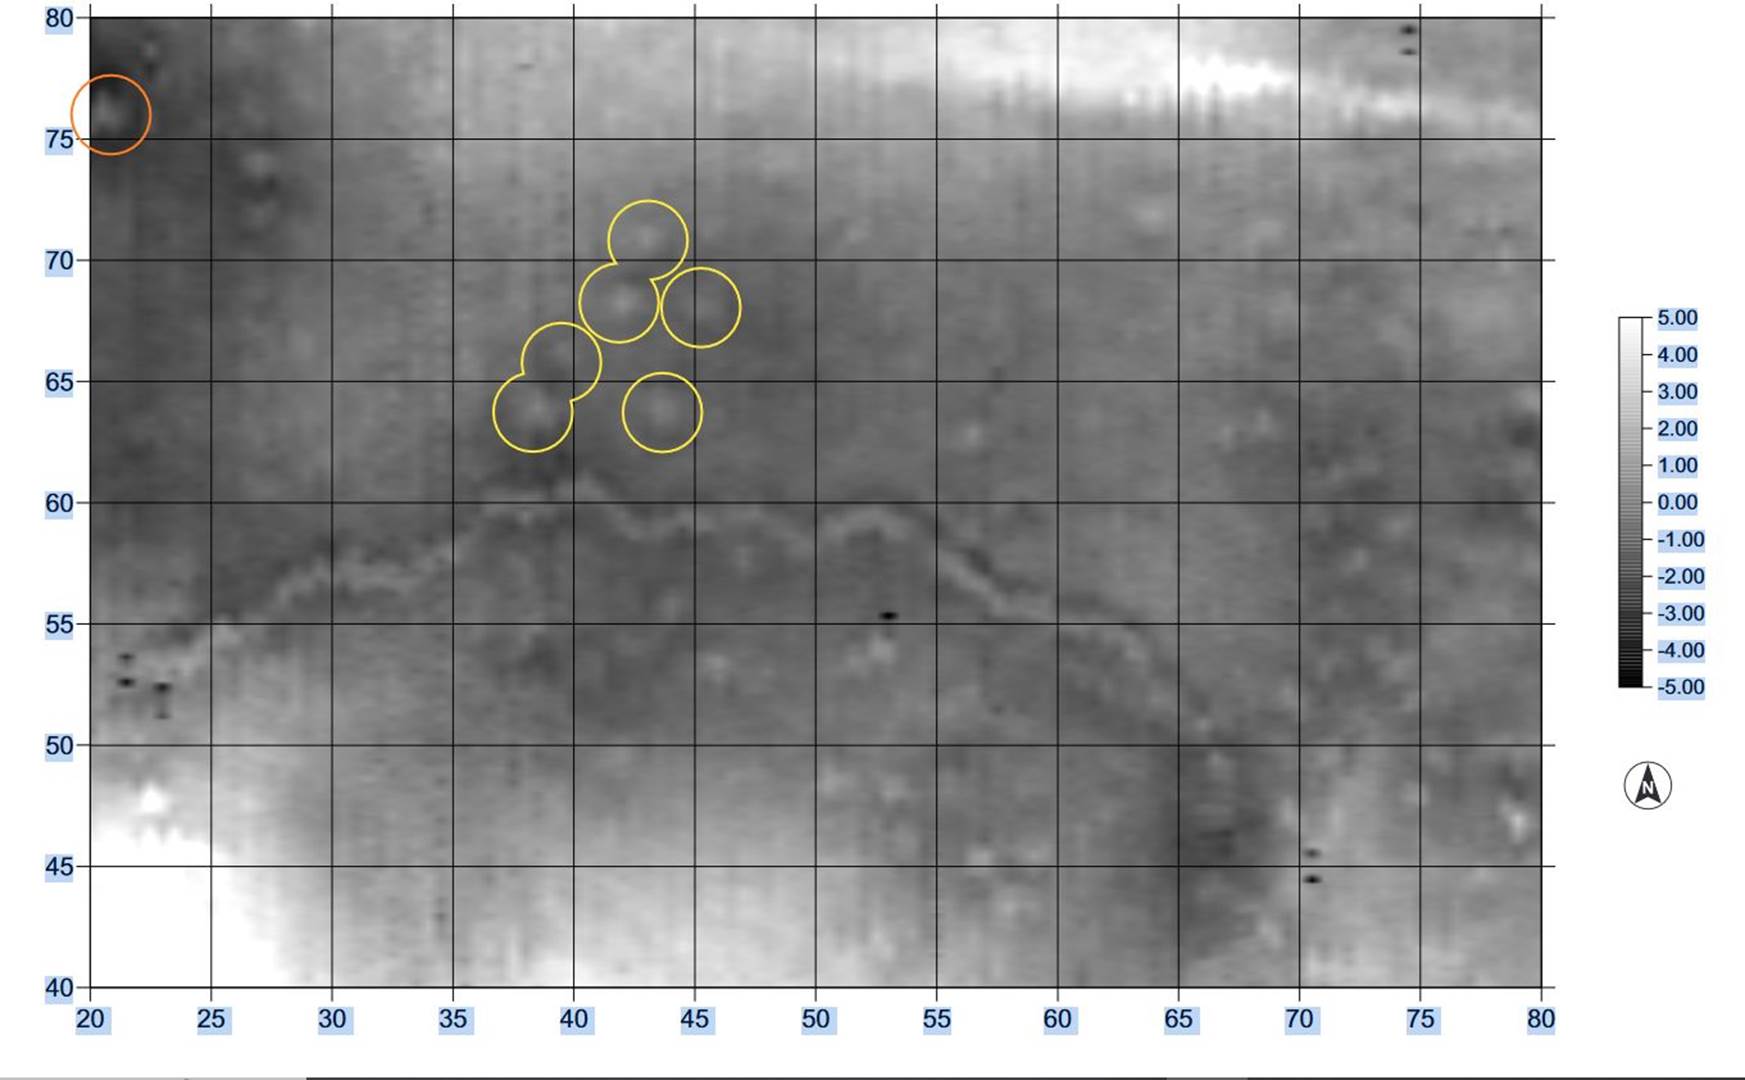
LORD Road Site with Magnetic Data
LORD Road Site with detail Magnetic
Data
Anomalies
of possible interest appear in both the Conductivity and susceptibility data.
Depths are below the plow zone, with sources possibly below 1m.
Instructors
Course
instructors consist of experienced practitioners, representatives of instrument
manufacturers, and software developers. This list is subject to change, but we
anticipate instructors such as Dr. Jarrod Burks, Ohio Valley Archaeology, Inc.;
Dr. Kris Lockyear, University College London; David Wilbourn, DW Consulting;
Dr. Larry Conyers, Denver University; Peter Leach, Geophysical Survey Systems,
Inc.; Dr. Lewis Somers, Geoscan Research USA; Geoff
Jones, Archaeo-Physics, LLC; Dr. Doug Scott, Colorado
Mesa University; and Chris Kenney, SPX (Sensors and Software).
More maps
of the Etzanoa sites from ArcGIS studies since 2014 http://www.normconley.net/normconleynet.htm
September
2023
Norm Conley